Excel formula needed.

bloubul

Member
Hi t*t
Thanks it does remove the 2nd digit from the double digits, but it also removes the single digits as well.

BlouBul :cool:
 

time*treat

Member
Conditionally -- handles single and double digits.
=IF(x>9,INT(x/10),x)

example
=IF(RC[-1]>9,INT(RC[-1]/10),RC[-1])
 

Frank

Member
Well theres more than one way of doing this, either by a combination of COUNTIF and IF statements to not count duplicate occurrences, per ball, or by using an OR function that you say counts the duplicates ? Not the way I write them. The OR function is less wordy in its raw form, and has to be used 5 times in each result, one per drawn ball, then adding the different 5 comparisons to get a total number of unique matches.
I would normally use hidden columns to store part results if it were for me, but you can combine all 5 functions into one long line of functions.
However you do it, a problem crops up for L5 and L10 when you cannot go back in time beyond the topmost result. You cannot look back 10 results if you are already checking any of the 9 (oldest) topmost results, for matches in the past which you dont have on the sheet. These bring up #REF! errors. I dont like to see those, so then you need the whole thing wrapped up in an IF(ISERROR .... function to replace the #REF! with something else. I have replaced #REF! with a dash -.

Sheet 1 and sheet 2 are the same, but sheet 2 has some notes attached.
These formulas only work for the current layout, the formula has to be on the same row as the result being checked (against others in the past). Presumably you know that if you click in the formula cell, then click on the formula bar, Excel shows you what the formulas are working on.

They can be safely copied downwards to new results, but not copied upwards where a dash exists ( say you inserted new rows and added earlier data at the top) the row referencing gets muddled when you ask it to do the impossible.
Anyway see what you make of this ...

http://www.mediafire.com/file/3flg1k2o056t0jn/Draws.xlsx/file
 

Frank

Member
Nice to see you too Blitzed, not many people post sensible items any more. It’s all been said before, but I still keep my brain ticking over doing spreadsheets, more to solve math puzzles these days.
 

cdrake

Member
I group the skips of a lotto number into ranges. Skip 1 to 2 are group 1. Skip 3 to 6 are group 2, skip 7 to 9 are group 3 and skip 10 and higher are group 4. This is done in excel 2007. I then analyze this column of numbers to try and determine if this number is going to hit while in this current group or is more likely to move out of the group. The column of numbers is similar to this.
Group
1
1
3
4
2
3
3
4
1
3
2
1
1
1
4
2
2
1
3 etc.
I was thinking of utilizing a countif statement to count the number of times each group hit while moving down the column and assigning it a value for example starting at the top of the column. 1 followed by another 1 would become 12 followed by a 31, 41, 21, 32, 41, 11, 31, 21, 13 etc. Using the count formula as it stands just gives me a total hit value which is not what I'm after. Once I get this column of numbers I'll use the median value to determine if the number is likely to repeat in this group or not. I could do this by hand but it would be extremely time consuming and I spend too much time as it is following and tracking 3 lotteries. Any help would be greatly appreciated.
 

bloubul

Member
Hi cdrake, welcome back.
How many draws do you use to do your groupings, is the skips the current skips? and what is your success rate
 

Frank

Member
I group the skips of a lotto number into ranges. Skip 1 to 2 are group 1. Skip 3 to 6 are group 2, skip 7 to 9 are group 3 and skip 10 and higher are group 4. This is done in excel 2007. I then analyze this column of numbers to try and determine if this number is going to hit while in this current group or is more likely to move out of the group. The column of numbers is similar to this.
Group
1
1
3
4
2
3
3
4
1
3
2
1
1
1
4
2
2
1
3 etc.
I was thinking of utilizing a countif statement to count the number of times each group hit while moving down the column and assigning it a value for example starting at the top of the column. 1 followed by another 1 would become 12 followed by a 31, 41, 21, 32, 41, 11, 31, 21, 13 etc. Using the count formula as it stands just gives me a total hit value which is not what I'm after. Once I get this column of numbers I'll use the median value to determine if the number is likely to repeat in this group or not. I could do this by hand but it would be extremely time consuming and I spend too much time as it is following and tracking 3 lotteries. Any help would be greatly appreciated.

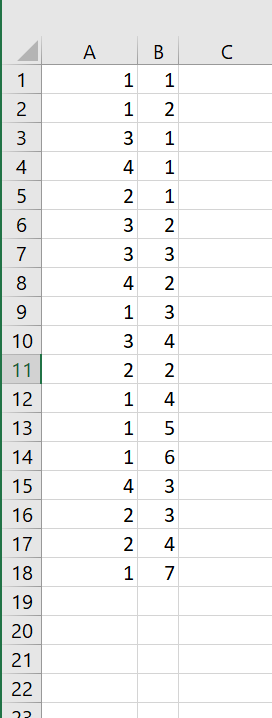
Hi, its not totally clear what you want because your list 31, 41, 21, 32, 41, 11, 31, 21, 13 confuses me. I understand 31, 41, 21, 32, but what follows looks like you've reset the counter ? I get different for the rest of the list. In the example below, The formula =COUNTIF(A$1:A1,A1) in cell B1, then copied down column B does a running count of each group as it encounters it. The $ anchors the range to the top of column A, but not using a $ for the other end of the range lets it expand as you move down the column. Note that the count is kept separate from the group number but is still adjacent to it so there is no confusion.
Is that what you were wanting to do ?
2021-07-22.png
 

cdrake

Member
Hi cdrake, welcome back.
How many draws do you use to do your groupings, is the skips the current skips? and what is your success rate
Hi bloubul, with the 3 Canadian lotteries that I play I use Nick Koutras Lottostatisticsxls to generate the Since Last Appeared. Rows that are empty of any numbers I eliminate. I then write it all out on a piece of paper and group according to what ever my imagination congers up. I then analyze this information utilizing Lottostatisticsxls with a heavy interests on the skips of the groupings. I'll then transfer the likes and dislikes back onto the paper which gives me a feeling of what areas might be more prone to hitting or missing for the draw. It does take a fair amount of time as I am tracking 3 lotteries and evaluating what's working and not working. I generally only play 2 combos for the national 649, 3 combos for the western649, and 1 to 2 combos for the lottomax. I only track the lottomax for the Friday draw as all of my data was built off of it being only a once a week draw. Do to the lousy pay out structure of this lottery I didn't want to commit any more time tracking it twice a week. In the end I tend to get free plays(2 winning numbers) 90% of the time and 3 number winners 10% of the time with the 649 lotteries. I also utilize GH charts 3,4,5,and 7 for their smart picks. I put this info into Lottostaticsxls and try to determine which chart will only hit for 0 to 1 number. Once I have that info I'll use the smart picks off that chart and filter those numbers out of the mix for that draw. I also employ other lottery software and have tracked their efficacy over a few years which is time consuming. So far none of them have lived up to any of their claims. My ultimate goal is to win the major prize but my immediate goal is 4 number winners on a consistent basis. Thank you for your reply.
 

cdrake

Member
Hi, its not totally clear what you want because your list 31, 41, 21, 32, 41, 11, 31, 21, 13 confuses me. I understand 31, 41, 21, 32, but what follows looks like you've reset the counter ? I get different for the rest of the list. In the example below, The formula =COUNTIF(A$1:A1,A1) in cell B1, then copied down column B does a running count of each group as it encounters it. The $ anchors the range to the top of column A, but not using a $ for the other end of the range lets it expand as you move down the column. Note that the count is kept separate from the group number but is still adjacent to it so there is no confusion.
Is that what you were wanting to do ?
2021-07-22.png
Hi Frank, sorry for my delayed reply as I've been busy at work. What I'm trying to achieve with the count is to determine when the group number in A column is hitting and or repeating as you move down the column. for instance moving down column A we have 1,1,3,4,2,3,3,4,etc. These are my assigned groups for the skips of a number. So in column B with the formula I would like to see an output of 12 as group 1 hit two times in a row followed by 31 followed by 41, 21. 32, 41 and so on if that makes is clear. Ill then use Lottostatisticsxls to analyze column B for its frequency and skips. I'll then take that information back to the 649 Since Last Appeared output file that was generated by lottostatisticsxls and be able to determine weather a number is going to hit in the group it currently resides in or if its more likely to move out of its current group and hit later on in another group. I hope this isn't too confusing. Thank you for all your help.
 

cdrake

Member
LottostisticsXL v114. There might be a newer version out there but this one suits my needs for what I'm able to do with it.
 

bloubul

Member
I cannot find LottostisticsXL v114 not even on blitzed site, I have almost all of Nick's spreadsheets, will you share your copy with me.
 

Sidebar

Top