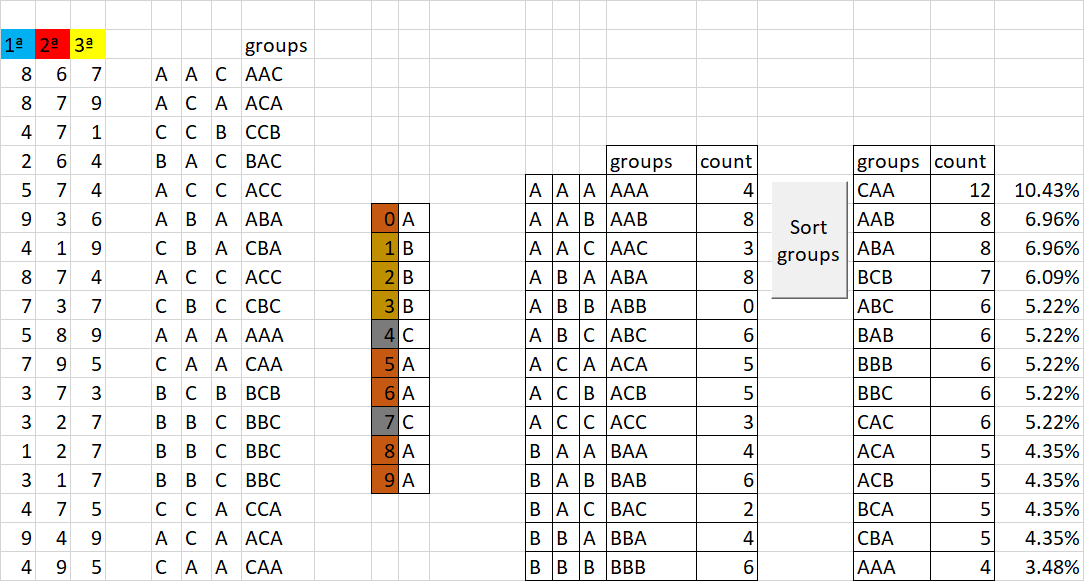
detect in each pick 3 position the three frequency groups from 0 to 9

Frank

Member
Well, its confusing when you talk about "hot" being a number in a column, e.g number 5 is hot and number 7 is cold, they are just numbers? Then you talk about one draw to the next, as if you want some process to take place between adjacent draws. You cant subtract ABC from CBB! All I can decipher from your post is this.-


Nothing else makes sense.
 

jack

Member
hello FRANK
ok let's go step by step, we have a pick3 list, you can put one with zero too, after seeing in each column or position, the frequency from 0 to 9 from the most drawn (5 hot) to the LEAST (2 cold) that is, in the descending one, the most drawn at least do this in the three columns 50% 5 35% 3 and 15% 2, we have 3 sectors represented by letters, a,b,c your brief sample shows that aaa, which means hot 5 hot 5 and hot 5 is of greater importance, since cold, that is, ccc has very little incidence of frequencies by position
 

jack

Member
27FORMAÇÕES NAS LETRAS A, BC
27​
FORMATIOMS
AAA
AAB
AAC
ABA
ABB
abc
ACA
ACB
ACC
BAA
BAB
BAC
BBA
BBB
BBC
BCA
BCB
BCC
CAA
TÁXI
CAC
CBA
CBB
CBC
CCA
CCB
CCC
 

jack

Member
9​
0​
3​
UMA
50% = 5 dígitos
0​
9​
7​
5 hotsUMA
1​
3​
4​
UMA
4​
8​
9​
UMA
2​
6​
0​
UMA
7​
2​
6​
B
35% = 3 dígitos
6​
1​
5​
3 mediusB
5​
5​
2​
B
3​
7​
8​
C
15% = 2 dígitos
8​
4​
1​
2 resfriadosC
0​
17​
17​
13​
1​
13​
11​
7​
2​
12​
11​
9​
3​
9​
12​
16​
4​
12​
8​
14​
5​
9​
10​
9​
6​
9​
11​
12​
7​
9​
9​
14​
8​
7​
11​
8​
9​
18​
15​
13​
 

jack

Member
FRANK !doing a brief manual simulation it is noticed that the cold cuts sector (the last two digits of the list from 0 to 9) which is represented by the letter c) in each position ie CCC are very rarely drawn or in other words we can create the fittro by 3 sectors, you can increase to 200 or 300 the random draws of pick3 to test
objective, is to filter by sector of frequencies in each position 50% to 5 digits the hottest the most drawn
35%=3 medium digits
15%= 2 cold digits
so in any pick3 list, it looks like
yyy, or tab. aab have a higher incidence than ccc or ccb
you have to do the frequency statistics in each position
 

jack

Member
hello frank, the above examples are just explanatory, of course you can put yours
ideas, the objective is to filter the three frequency sectors by position, ok
 

Frank

Member
Doubts? I haven’t got the slightest idea what you are doing. I told you I didn’t understand what you were measuring the frequency of. The numbers in the columns have frequencies more than the figures in your hot and cold table. You have not commented on my screenshot, said what is wrong with it or what is right with it. I haven’t time to play guessing games. I’m out!
 

jack

Member
ok,FRANK! let's take it easy, on the screen it is correct, on the frequency by position of the digits 0 to 9
you have to do the digits from the biggest to the smallest
and then make the section of the 3 sectors = 50% 35% 15% in each position, the 1000 will be in the reduction of 27 patterns aaa. aab ... ccc 27 formations
for example an aaa result means that in the three positions it was hot, that is, the group 50% 5 digits
my goal is to cross by frequency patterns
by position that are 50% hot = 5 , 35% medium = 3 and cold 2 digits
 

jack

Member
OK! I managed to download it now! it was great work, you can put your ideas anytime you want, thanks FRANK
 

Sidebar

Top